What is XIRR in Mutual Funds? Meaning, Working, Formula
Published: 21 Oct 2026
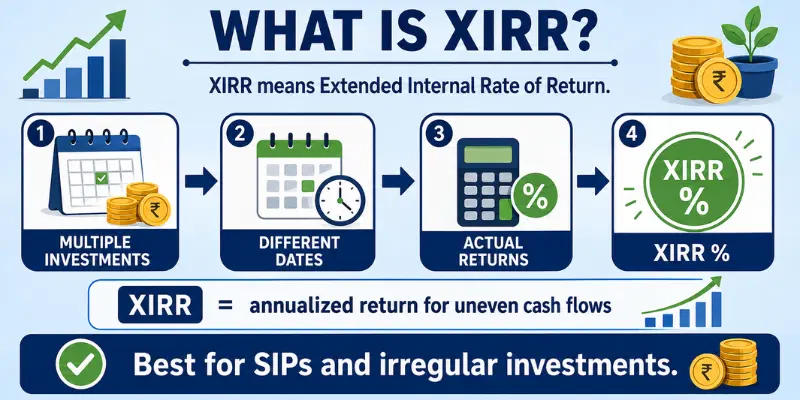
XIRR is a financial method used to calculate annualized returns when investments and withdrawals happen on different dates. It considers both the amount and timing of every cash flow, making it useful for SIPs, mutual funds, stocks, and investment portfolios. Unlike simple return methods, XIRR provides a clearer picture of actual investor-level performance. It is especially helpful when regular or irregular transactions take place over several months or years.
1. What Is XIRR?
XIRR stands for Extended Internal Rate of Return and measures annualized returns when investments or withdrawals happen on different dates. It considers both the amount and exact date of every transaction. For example, if you invest ₹5,000 every month through a SIP, each payment remains invested for a different period. XIRR uses all monthly investments, transaction dates, and the final portfolio value to calculate one annualized return. It can also handle extra deposits, partial withdrawals, and irregular investments. This makes it more suitable than simple return methods for portfolios with multiple cash flows. Investors commonly use XIRR to measure returns from SIPs, mutual funds, stocks, and other investment portfolios.
2. How Does XIRR Work?
Extended Internal Rate of Return works by using every investment, withdrawal, and transaction date in the calculation. Investments are entered as negative cash flows because money is going out, while withdrawals and the final portfolio value are entered as positive cash flows because money is coming back. It then calculates the annualized rate at which the total value of all cash flows becomes balanced.
For example, suppose you invest ₹5,000 on different dates and later receive a final portfolio value. Each payment stays invested for a different period, so XIRR gives more importance to the timing of every transaction. The final result is shown as one yearly percentage, helping investors understand the actual performance of SIPs and portfolios with multiple cash flows.
3. Importance of XIRR
XIRR is important because it gives a more realistic annualized return when investments and withdrawals happen on different dates. It considers both the amount and timing of every cash flow, which makes it especially useful for SIPs, mutual funds, stocks, and portfolios with irregular transactions. Instead of showing only total profit, it explains how efficiently the investment performed over time.
- It considers the exact date of every investment and withdrawal.
- It is suitable for SIPs and other regular investment plans.
- It handles multiple deposits, partial withdrawals, and irregular cash flows.
- It provides one annualized return for the complete investment period.
- It helps investors compare different investments more fairly.
- It gives a clearer picture than simple or absolute return methods.
- It is useful for tracking personal portfolio performance.
- It helps investors review whether their financial strategy is working properly.
4. XIRR Formula
The XIRR formula calculates the annualized return by setting the present value of all investment cash flows equal to zero.
1. XIRR Formula
The XIRR formula calculates the annualized return by setting the present value of all investment cash flows equal to zero.
XIRR Formula:
Σ [Cash Flow ÷ (1 + r)^((Transaction Date − First Date) ÷ 365)] = 0
Here:
Cash Flow means each investment, withdrawal, or final portfolio value.
r represents the annualized return calculated by XIRR.
Transaction Date means the exact date of each cash flow.
First Date is the date of the first investment.
365 converts the difference between dates into years.
Investments are entered as negative amounts, while withdrawals and the final portfolio value are entered as positive amounts. Since this equation is difficult to solve manually, investors usually use Excel, Google Sheets, or an XIRR calculator to find the final percentage.
| Cash Flow | Date |
|---|---|
| -₹5,000 | 1 January 2025 |
| -₹5,000 | 1 February 2025 |
| -₹5,000 | 1 March 2025 |
| ₹16,500 | 31 December 2025 |
5. How to Calculate XIRR Step by Step
There are following step to Calculate:
1. Step 1: List All Cash Flows
Write down every investment, withdrawal, dividend, and final portfolio value. Investments should be entered as negative values because money is going out of your account.
2. Step 2: Add Exact Transaction Dates
Enter the exact date of each cash flow beside its amount. XIRR uses these dates to calculate how long every investment remained active.
3. Step 3: Mark Positive and Negative Values
Enter investments as negative numbers. Enter withdrawals, dividends, and the final portfolio value as positive numbers.
4. Step 4: Arrange the Data in Two Columns
Create one column for cash-flow amounts and another for transaction dates. Make sure every amount matches the correct date.
5. Step 5: Use the XIRR Function
In Excel or Google Sheets, enter:
6. Step 6: Convert the Result into a Percentage
The function returns the annualized rate in decimal form. Format the result as a percentage to understand the investment return easily.
7. Step 7: Review the Result
Suppose the result is 0.118. After converting it into a percentage, the XIRR is 11.8% per year. This means the complete investment earned an annualized return of approximately 11.8%, considering the timing of every cash flow.
6. XIRR for Mutual Funds
XIRR is useful for calculating mutual fund returns when investments and withdrawals happen on different dates. It considers SIP instalments, additional investments, partial redemptions, dividends, and the final portfolio value. Each investment is entered as a negative cash flow, while withdrawals and the current value are entered as positive cash flows.
For example, an investor may invest ₹5,000 every month through a SIP and later make an extra investment of ₹20,000. Since every amount remains invested for a different period, a simple return calculation may not show the correct performance. XIRR uses all transaction amounts and dates to calculate one annualized return for the complete mutual fund investment.
It is especially useful for comparing the investor’s actual return with a benchmark or another mutual fund. However, the result depends on accurate transaction records and the correct current portfolio value. XIRR shows annualized performance, but it does not measure risk or guarantee future returns.
7. XIRR for Stocks and Portfolios
XIRR is useful for measuring returns when stocks or other assets are bought and sold on different dates. It considers additional purchases, partial sales, dividends, withdrawals, and the current portfolio value. Each purchase is entered as a negative cash flow, while sales, dividends, and the final value are entered as positive cash flows.
For example, an investor may buy shares worth ₹50,000 in January, invest another ₹30,000 in June, and sell some shares for ₹20,000 in October. If the remaining portfolio is worth ₹75,000 at the end of the year, XIRR uses all these amounts and dates to calculate one annualized return.
This method gives a clearer picture than a simple profit percentage because it considers how long each amount remained invested. However, XIRR only measures portfolio performance and does not show market risk, volatility, or future return potential. Accurate transaction dates and values are necessary to calculate a reliable result.
8. XIRR vs CAGR
XIRR and cagr both measure annualized investment returns, but they are used in different situations. CAGR works best when there is one initial investment and one final value with no additional transactions. XIRR is more suitable when several investments, withdrawals, or dividends occur on different dates because it considers the amount and timing of every cash flow.
For example, CAGR can measure the growth of ₹1,00,000 to ₹1,50,000 over three years when no extra money is added. XIRR is better when you invest ₹5,000 every month because each instalment remains invested for a different period. In simple words, use CAGR for a single lump sum and XIRR for multiple transactions.
| Comparison Point | XIRR | CAGR |
|---|---|---|
| Full Form | Extended Internal Rate of Return | Compound Annual Growth Rate |
| Cash Flows | Handles multiple cash flows | Uses one beginning and one ending value |
| Transaction Dates | Uses the exact date of every transaction | Uses only the total investment period |
| Best Suited For | SIPs and irregular investments | Lump sum investments |
| Withdrawals | Can include partial withdrawals | Does not properly handle withdrawals |
| Calculation | More complex | Simple |
| Main Result | Actual annualized investor return | Average annual compounded growth |
| Common Use | SIPs, portfolios, and mutual funds | Stocks, business growth, and lump sums |
9. XIRR vs ROI
XIRR and ROI both measure investment performance, but they show different types of returns. XIRR calculates the annualized return by considering every investment, withdrawal, and transaction date. ROI, or Return on Investment, shows the total profit or loss compared with the original amount but does not automatically consider how long the money remained invested.
For example, if you invest ₹1,00,000 and later receive ₹1,30,000, the ROI is 30%. However, ROI does not show whether this return took one year or five years. XIRR considers the timing of all transactions and converts the result into an annualized percentage, making it more suitable for investments with multiple cash flows.
| Comparison Point | XIRR | ROI |
|---|---|---|
| Full Form | Extended Internal Rate of Return | Return on Investment |
| Main Purpose | Measures annualized return | Measures total profit or loss |
| Time Factor | Considers exact transaction dates | Usually ignores the investment period |
| Cash Flows | Handles multiple deposits and withdrawals | Best for simple starting and ending values |
| Result | Annual percentage | Total percentage |
| Best Suited For | SIPs, portfolios, and irregular investments | Simple investment profitability |
| Calculation | More detailed | Simple |
| Accuracy | More useful for complex cash flows | Useful for basic return comparison |
10. XIRR vs IRR
XIRR and IRR both calculate annualized returns, but they treat transaction timing differently. IRR assumes that all cash flows occur at equal intervals, such as monthly or yearly. XIRR uses the exact date of every investment, withdrawal, and final value, making it more suitable for real-life investments with irregular transactions.
For example, irr may work well when cash flows happen at the end of every year. XIRR is better when investments are made on different dates, such as January 5, March 20, and August 10. In simple words, use IRR for regular intervals and XIRR for irregular transaction dates.
| Comparison Point | XIRR | IRR |
|---|---|---|
| Full Form | Extended Internal Rate of Return | Internal Rate of Return |
| Transaction Timing | Uses exact dates | Assumes equal intervals |
| Cash Flows | Suitable for irregular cash flows | Suitable for regular cash flows |
| Best Suited For | SIPs, mutual funds, stocks, and portfolios | Business projects and regularly spaced payments |
| Date Requirement | Exact dates are required | Exact dates are not required |
| Accuracy | More practical for uneven transactions | Useful when intervals are consistent |
| Spreadsheet Function | XIRR(values, dates) | IRR(values) |
| Final Result | Annualized return | Periodic return based on equal intervals |
| Advantages of XIRR |
|---|
|
| Disadvantages of XIRR |
|---|
|
11. Common XIRR Errors
1. #NUM! Error
The #NUM! error may appear when Excel or Google Sheets cannot find a suitable return rate. This often happens when the cash flows do not include at least one negative value and one positive value. It may also occur when the transaction pattern is too unusual for the calculation.
2. #VALUE! Error
The #VALUE! error usually appears when transaction dates or cash-flow amounts are entered incorrectly. Dates may be stored as text instead of valid date values. Check every cell and make sure the amounts and dates are in the correct format.
3. Missing Positive Cash Flow
XIRR needs at least one positive cash flow, such as a withdrawal, dividend, or final portfolio value. Without it, the function cannot measure the return. Always include the current or final investment value as a positive amount.
4. Missing Negative Cash Flow
Investments should be entered as negative cash flows because money is going out. If all values are positive, the function will not work correctly. Make sure every investment amount has a minus sign.
5. Incorrect Transaction Dates
Wrong dates can change the final result or create an error. Each cash flow must have a valid matching date. Avoid entering incomplete, duplicate, or text-formatted dates.
6. Wrong Cash-Flow Signs
A common mistake is entering investments as positive values and withdrawals as negative values. This reverses the meaning of the transactions and may give an incorrect answer. Investments should be negative, while withdrawals and final values should be positive.
7. Missing Final Portfolio Value
The calculation may remain incomplete when the current portfolio value is not included. Add the latest market value as a positive cash flow on the valuation date. This helps measure the return up to that date.
12. Common XIRR Mistakes
- Using incorrect transaction dates: Even a small date error can change the final return. Always use the exact date of every investment, withdrawal, and valuation.
- Entering cash flows with the wrong signs: Investments should be negative, while withdrawals, dividends, and the final portfolio value should be positive.
- Forgetting the final portfolio value: Without the latest value, the calculation remains incomplete. Add it as a positive cash flow on the valuation date.
- Leaving out transactions: Missing SIP instalments, partial withdrawals, extra investments, or dividends can produce an inaccurate result.
- Using an estimated current value: An incorrect portfolio value can make the return misleading. Use the actual market value available on the selected date.
- Comparing different investment periods: A one-year result should not be directly compared with a ten-year result. Use similar periods for a fair comparison.
- Ignoring taxes and charges: XIRR may not automatically reflect taxes, brokerage, exit load, or other fees unless you include them in the cash flows.
- Treating XIRR as total return: XIRR shows an annualized return, not the total percentage gained during the complete period.
13. Tips for Using XIRR Correctly
- Use the exact date of every investment, withdrawal, and dividend.
- Enter investments as negative cash flows.
- Enter withdrawals and the final portfolio value as positive cash flows.
- Include all SIP instalments, extra deposits, and partial redemptions.
- Use the latest accurate portfolio value on the valuation date.
- Check that every cash flow has a matching transaction date.
- Review the data before applying the XIRR function.
- Include taxes, fees, and charges when measuring your actual return.
- Compare investments over similar periods for a fair result.
- Do not judge an investment only by a high XIRR.
- Review risk, volatility, consistency, and fund category as well.
Yes, XIRR is suitable for SIPs because every instalment is invested on a different date. It considers the amount and timing of each payment. This gives a more realistic annualized return.
XIRR handles multiple cash flows and exact transaction dates. CAGR works best with one beginning value and one ending value. Therefore, XIRR is better for SIPs, while CAGR is simpler for lump sum investments.
Yes, XIRR can be negative when the investment value falls over time. It shows the average annualized loss after considering all cash flows. A negative result means the investment has not recovered the amount invested.
Excel may show an error when dates, values, or cash-flow signs are incorrect. The data must include at least one negative and one positive cash flow. Missing final value or invalid dates can also cause errors.
A higher XIRR usually shows stronger past performance. However, it may also come with higher risk and larger market fluctuations. Investors should also review volatility, consistency, fees, and investment duration.
No, XIRR only measures past investment performance. It cannot guarantee that the same return will continue in the future. Market conditions and portfolio value can change over time.
Conclusion
So guys, in this article, we’ve covered What is XIRR in detail. It is a useful method for measuring annualized returns when investments and withdrawals happen on different dates. In my opinion, investors should use accurate transaction dates, correct cash-flow signs, and the latest portfolio value to get a reliable result. XIRR can provide a clearer view of sip, mutual fund, stock, and portfolio performance, but it should not be used alone to judge risk. Review your investment records today and calculate your actual annualized return correctly.
The information and calculators on Finance Calculatorz are provided for educational purposes only. Calculator results are estimates and may not always be fully accurate. This content is not financial, investment, tax, or legal advice. Please consult a qualified professional before making any financial decision.



- Be Respectful
- Stay Relevant
- Stay Positive
- True Feedback
- Encourage Discussion
- Avoid Spamming
- No Fake News
- Don't Copy-Paste
- No Personal Attacks
- Be Respectful
- Stay Relevant
- Stay Positive
- True Feedback
- Encourage Discussion
- Avoid Spamming
- No Fake News
- Don't Copy-Paste
- No Personal Attacks
