What is CAGR? Working, Features, Benefits
Published: 19 Oct 2026
Are you confused about how much your investment has actually grown each year? Total return may show the overall profit, but it does not clearly explain the average annual growth rate. CAGR solves this problem by converting long-term growth into one simple yearly percentage. It also considers compounding, which makes it more useful than a basic average return. By understanding Compound Annual Growth Rate, you can compare investments over different periods more easily.
1. What Is CAGR?
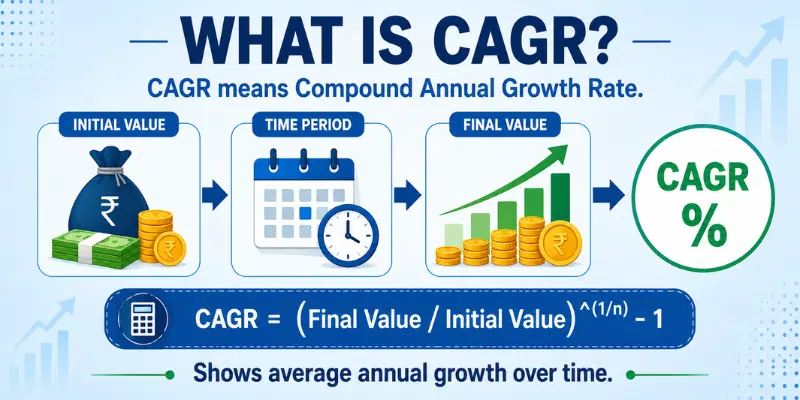
CAGR stands for Compound Annual Growth Rate and shows the average yearly growth of an investment over a specific period. It uses the beginning value, ending value, and total number of years to calculate one simple annual percentage. For example, if an investment grows from ₹1,00,000 to ₹1,50,000 in three years, CAGR shows the average compounded growth during that time. It does not mean the investment earned the same return every year. Instead, it smooths all yearly changes into one rate. This makes long-term performance easier to understand and compare.
2. Working of CAGR
CAGR works by comparing the beginning value of an investment with its ending value over a selected number of years. It calculates the fixed annual growth rate that would be required for the starting amount to reach the final amount through compounding. For example, if an investment grows from ₹1,00,000 to ₹1,50,000 in three years, Compound Annual Growth Rate shows the average compounded growth achieved each year.
However, CAGR does not represent the actual return earned in every individual year. The investment may rise in one year, fall in another, and grow again later, but the calculation converts these changes into one smooth annual rate. This makes long-term growth easier to understand and allows investors to compare different investments over the same period.
3. Features of CAGR
Compound Annual Growth Rate provides a simple way to understand long-term growth. Its main features include:
- It shows the average annual growth rate over a selected period.
- It considers the effect of compounding on the starting value.
- It uses the beginning value, ending value, and number of years.
- It presents long-term performance as one simple percentage.
- It helps compare investments over the same time period.
- It can measure growth in investments, revenue, sales, and profits.
- It smooths yearly changes but does not show actual annual fluctuations.
- It works best when there are no additional investments or withdrawals.
4. Formula of CAGR
The formula of CAGR uses the beginning value, ending value, and total number of years to calculate the average annual growth rate.
CAGR = [(Ending Value ÷ Beginning Value)^(1 ÷ Number of Years) − 1] × 100
Here:
- Beginning Value means the initial value of the investment.
- Ending Value means the final value after the selected period.
- Number of Years means the total investment duration.
- × 100 converts the result into a percentage.
For example, if an investment grows from ₹1,00,000 to ₹1,50,000 in three years, these values are placed in the formula to find its Compound Annual Growth Rate. A cagr calculator can also provide the result quickly without manual calculation.
5. How to Calculate CAGR Step by Step
1. Step 1: Find the Beginning Value
Identify the starting value of your investment. For example, suppose you invested ₹1,00,000.
2. Step 2: Find the Ending Value
Check the final value of the investment after the selected period. Suppose the investment grows to ₹1,50,000.
3. Step 3: Calculate the Number of Years
Count the total number of complete years between the starting and ending dates. In this example, the investment period is three years.
4. Step 4: Divide the Ending Value by the Beginning Value
Divide ₹1,50,000 by ₹1,00,000.
₹1,50,000 ÷ ₹1,00,000 = 1.5
5. Step 5: Apply the Power of 1 ÷ Number of Years
Raise 1.5 to the power of 1 divided by 3.
1.5^(1 ÷ 3) = 1.1447
6. Step 6: Subtract 1
Subtract 1 from the calculated value.
1.1447 − 1 = 0.1447
7. Step 7: Convert It into a Percentage
Multiply the result by 100.
0.1447 × 100 = 14.47%
Therefore, the investment earned a Compound Annual Growth Rate of approximately 14.47% over three years. This means it grew at an average compounded rate of 14.47% per year, although the actual return may have been different in each year.
| Advantages of CAGR |
|---|
|
| Disadvantages of CAGR |
|---|
|
8. CAGR vs Average Annual Return
CAGR shows the average compounded growth of an investment between its starting and ending values. It assumes that the investment grew at a steady rate and that gains were reinvested each year. Average Annual Return simply adds the yearly returns and divides the total by the number of years, without fully considering compounding.
For example, suppose an investment earns 20% in the first year, loses 10% in the second year, and earns 15% in the third year. The Average Annual Return is calculated by adding these returns and dividing by three, but the result may not show the investment’s actual compounded growth. Compound Annual Growth Rate gives a more realistic view of how the investment value changed over the complete period.
1. Comparison
In simple words, CAGR is more useful for measuring how an investment actually grew over several years, while Average Annual Return only shows the arithmetic average of its yearly returns.
| Point | CAGR | Average Annual Return |
|---|---|---|
| Main Purpose | Measures compounded annual growth | Measures the simple average of yearly returns |
| Compounding | Included | Not fully included |
| Values Required | Beginning value, ending value, and years | Individual yearly returns |
| Yearly Fluctuations | Smooths them into one rate | Includes them in the average |
| Best Used For | Long-term investment growth | Understanding average yearly performance |
| Accuracy | Better for compounded growth | May differ from the actual growth rate |
9. CAGR vs XIRR
CAGR measures the average annual growth of an investment using only its beginning value, ending value, and investment period. It is most suitable for a lump sum investment where no additional deposits or withdrawals take place. Compound Annual Growth Rate assumes that the investment grew at a steady compounded rate, even when the actual yearly returns were different.
XIRR stands for Extended Internal Rate of Return. It calculates returns when multiple investments or withdrawals happen on different dates. Therefore, xirr is generally more suitable for SIPs, irregular investments, and portfolios with several cash flows.
1. Comparison
For example, CAGR may be used when ₹1 lakh grows to ₹1.5 lakh over three years without any additional investment. XIRR is more useful when ₹5,000 is invested every month because each payment stays invested for a different period. In simple words, use CAGR for a single lump sum and XIRR for multiple cash flows.
| Point | CAGR | XIRR |
|---|---|---|
| Full Form | Compound Annual Growth Rate | Extended Internal Rate of Return |
| Cash Flows | One initial investment and one final value | Multiple investments and withdrawals |
| Transaction Dates | Uses the total investment period | Uses the exact date of each transaction |
| Best Suited For | Lump sum investments | SIPs and irregular cash flows |
| Calculation | Simple | More detailed |
| Main Purpose | Measures average annual growth | Measures the actual annualized return |
| Common Use | Stocks, mutual funds, and business growth | SIPs, portfolios, and irregular investments |
10. CAGR vs ROI
CAGR shows the average annual compounded growth of an investment over a specific period. It uses the beginning value, ending value, and number of years. ROI, or Return on Investment, shows the total profit or loss compared with the original investment, but it does not automatically consider how long the investment was held.
1. Comparison
For example, if ₹1,00,000 grows to ₹1,50,000 in five years, the ROI is 50%. However, this figure does not show the average yearly growth. CAGR converts the same result into an annual compounded rate, making it more useful when comparing investments held for different periods.
| Point | CAGR | ROI |
|---|---|---|
| Full Form | Compound Annual Growth Rate | Return on Investment |
| Main Purpose | Measures average annual growth | Measures total profit or loss |
| Time Period | Included in the calculation | Not automatically considered |
| Compounding | Included | Usually not included |
| Result | Annual growth percentage | Overall return percentage |
| Best Used For | Long-term performance comparison | Measuring total investment profitability |
| Values Required | Beginning value, ending value, and years | Initial cost and final gain or value |
11. Common CAGR Mistakes
- Using the wrong number of years: Even a small error in the investment period can change the final result. Always calculate the exact duration between the beginning and ending values.
- Confusing CAGR with total return: Total return shows overall growth, while CAGR shows average annual compounded growth. Both figures explain different parts of performance.
- Using it for SIPs: CAGR is not ideal when several investments are made on different dates. XIRR is usually more suitable for SIPs and irregular cash flows.
- Ignoring additional deposits or withdrawals: Extra transactions can make the calculation misleading. Use only cases with one starting value and one ending value.
- Comparing different time periods: A three-year rate should not be directly compared with a ten-year rate. Use the same duration for a fair comparison.
- Assuming growth was steady: Compound Annual Growth Rate smooths the result into one annual percentage. It does not mean the investment earned the same return every year.
- Ignoring risk and volatility: A high growth rate may come with large market fluctuations. Always check risk along with returns.
- Treating past performance as guaranteed: Historical growth cannot promise similar future results. Market conditions can change over time.
12. Tips for Using CAGR Correctly
- Use accurate beginning and ending values.
- Select the correct investment duration.
- Compare investments over the same time period.
- Use XIRR when multiple cash flows are involved.
- Review yearly returns to understand volatility.
- Consider inflation, taxes, fees, and other costs.
- Compare investments within the same category.
- Check three-year, five-year, and longer periods for consistency.
- Use a reliable tool to Calculate Your CAGR accurately.
- Do not make an investment decision based on one growth figure alone.
CAGR stands for Compound Annual Growth Rate. It shows the average annual growth of an investment over a specific period. It includes the effect of compounding.
No, CAGR is not the same as the actual return earned each year. It smooths several years of growth into one annual percentage. The real yearly returns may be higher, lower, or even negative.
Yes, CAGR can be negative when the ending value is lower than the beginning value. A negative result shows that the investment declined over the selected period. It represents the average annual rate of that decline.
A higher CAGR generally shows stronger past growth. However, it may also come with greater risk and larger market fluctuations. Investors should compare risk, consistency, fees, and the investment period as well.
CAGR is not ideal for SIPs because multiple payments are made on different dates. XIRR is usually more suitable for investments with several cash flows. CAGR works best for a single lump sum investment.
Standard CAGR normally shows nominal growth and does not automatically include inflation. Inflation can reduce the real value of your returns over time. Therefore, investors should compare investment growth with the inflation rate.
No, CAGR only explains how an investment performed in the past. It does not guarantee the same growth rate in the future. Market conditions, risk, and investment performance can change over time.
Conclusion
So guys, in this article, we’ve covered CAGR in detail. It is a useful method for measuring the average annual growth of an investment over a specific period. However, it does not show yearly fluctuations, risk, or irregular cash flows. In my opinion, you should use it with other return and risk measures before making any investment decision. Compare your investments carefully and use the correct figures to understand their long-term performance.
The information and calculators on Finance Calculatorz are provided for educational purposes only. Calculator results are estimates and may not always be fully accurate. This content is not financial, investment, tax, or legal advice. Please consult a qualified professional before making any financial decision.



- Be Respectful
- Stay Relevant
- Stay Positive
- True Feedback
- Encourage Discussion
- Avoid Spamming
- No Fake News
- Don't Copy-Paste
- No Personal Attacks
- Be Respectful
- Stay Relevant
- Stay Positive
- True Feedback
- Encourage Discussion
- Avoid Spamming
- No Fake News
- Don't Copy-Paste
- No Personal Attacks
